HTML Report & Dashboard
Visualize your project's decisions, progress, patterns, and custom data. Compiles your entire context database into a single, self-contained interactive HTML file that opens in your browser.
How to Open the Report
To generate the report and launch your system's default browser to view the interactive dashboard, run:
engrams report openCustomizing the Output
By default, the HTML file is written to your system's temporary directory and opened immediately. You can customize this behavior with the following options:
- Write without opening: If you want to generate the HTML report but skip launching the browser (for example, in CI/CD pipelines or background scripts), use
--no-browser:engrams report open --no-browser - Specify output file: To save the HTML file to a custom path (useful for hosting or archiving), pass the
--outparameter:engrams report open --out ./dist/report.html
Dashboard Interface & Features
The dashboard is split into several tabs to help you explore your codebase's state:
1. Knowledge Graph
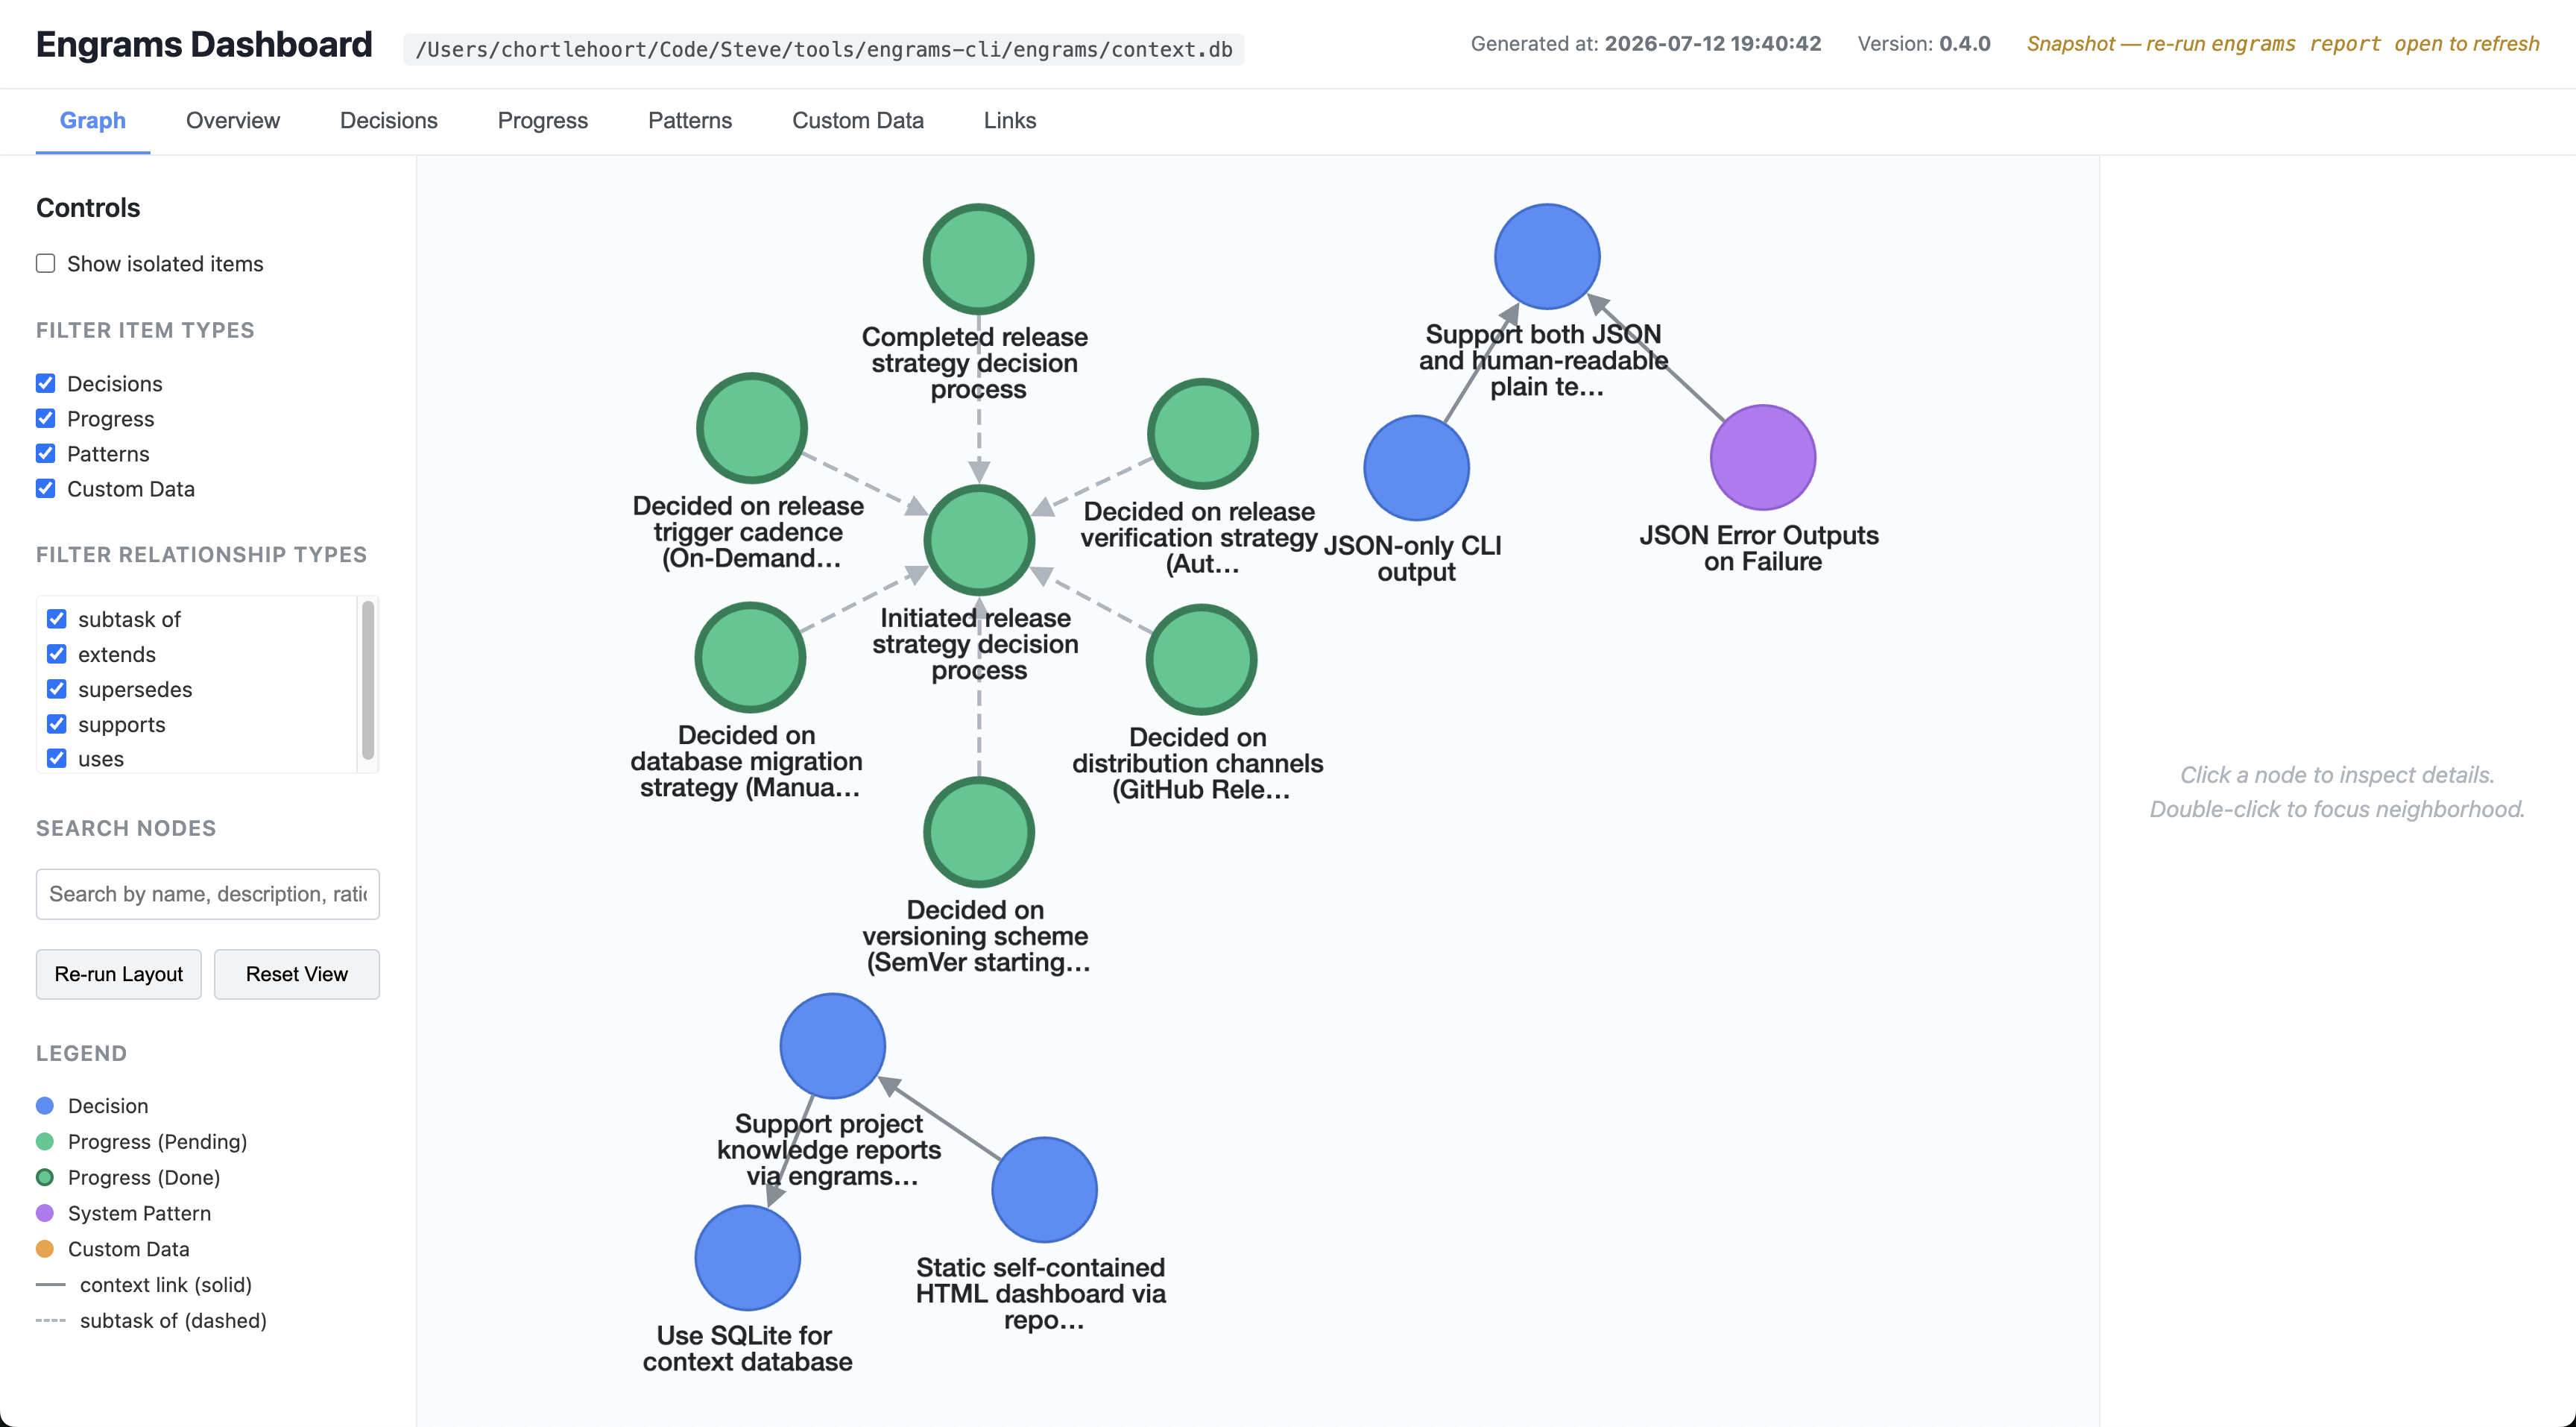
The default view renders an interactive node-link diagram showing the relationships between your project's entities:
- Interactive Nodes: Colored nodes represent different entity types (Blue for Decisions, Green for Progress, Purple for System Patterns, Orange/Yellow for Custom Data). Click any node to inspect its complete details in the right-hand panel, or double-click a node to focus on its immediate neighborhood.
- Filtering: Use the left-side control panel to toggle isolated items, filter which item types are visible, or filter by specific relationship types (such as subtask of, extends, supersedes, supports, and uses).
- Search: Easily find nodes by searching for text within their names, descriptions, or rationales.
- Layout Controls: Re-run Cytoscape's layout algorithm or reset the viewport view at any time.
2. Structured Tabs
Explore your project's context in tabular and readable forms:
- Overview: Displays overall metrics, database metadata, and the latest versions of your Product Context and Active Context.
- Decisions: Lists all logged Architectural Decision Records (ADRs) with their rationale, status, and tags.
- Progress: Tracks the timeline and status of your active sprint tasks.
- Patterns: Shows registered codebase patterns and practices.
- Custom Data: Contains general-purpose metadata categories and key-value records.
- Links: Lists all defined relationships between nodes in a structured list.